The software has not been updated since 2015. In recent years there have been radical changes in Java policies that make installation on some operating systems particularly difficult.
ProMeta 4 is in development. You can find updates here.
ProMeta 3.0 is a professional statistical software for conducting meta-analysis. It is based on ProMeta 2.1 deployed by Internovi. The core of the software is identical to version 2.1, with minimal changes to enable installation.
Features
- USER-FRIENDLINESS: Use of ProMeta is very intuitive and simple
- COMPLETENESS: ProMeta offers several tools for dealing effectively with complex meta-analytic data (e.g., multiple data entry formats, subgroups, comparisons, waves, and outcomes)
- HIGH RESOLUTION PLOT: ProMeta adopts the new software C.I.P. (Confidence Interval Plotter) to realize personalized very high quality graphs.
Both the researcher who approaches the meta-analysis for the first time and the expert meta-analyst will find in ProMeta an excellent instrument for performing their meta-analytic reviews.
Innovative graphic interface
ProMeta is a software extremely intuitive. It does not present the usual spreadsheet typical of many statistical packages but it is organized with an innovative graphic interface. Commands are very easy: you just need to right-click on variables or drag and drop them to prepare your project.
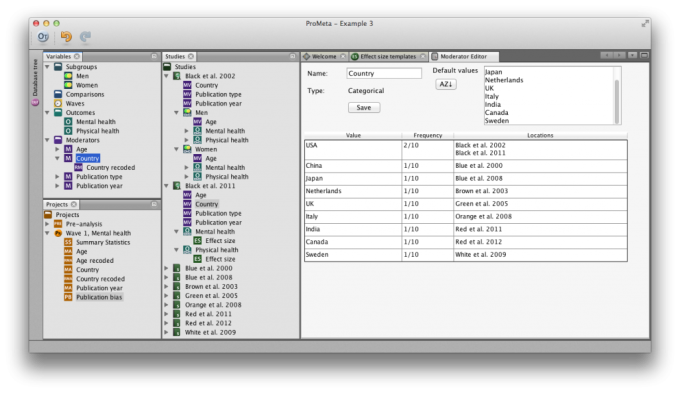
A new way of saving data
A true innovation of ProMeta is the system used for saving data and analyses. ProMeta has an integrated relational database so it does not need external files. This means that every time you work on a meta-analysis, it is automatically updated and available for your next use. Furthermore, ProMeta offers tools for exporting your meta-analysis to file and for importing it in other computers.
Solutions for complex data structures
Main problems that most researchers have to face when they conduct their meta-analytic reviews are represented by the heterogeneity of primary studies. Researchers might have to manage data of multiple subgroups, comparisons, waves, and/or outcomes reported in each primary study. Furthermore, data formats could vary from one study to the other making even more difficult to synthesize them.
If you are “struggling” with complex data structures, do not panic! ProMeta offers several tools for managing these situations.
Subgroups, comparisons, waves, and/or outcomes
In ProMeta you can easily define multiple subgroups, comparisons, waves, and/or outcomes and assign them to studies in which they are reported.
Data entry types and effect sizes
In ProMeta you can select, for each study, its own data entry type. You can choose among a large array of options.
Various types of data:
- means
- correlations (Pearson’s, Kendall’s Tau, and Spearman’s Rho)
- binary data
- survival data (Hazard ratio)
- incidence rates
Various types of design:
- design with independent groups or matched groups
- cross-sectional or longitudinal designs
Numerous data entry types
ProMeta offers numerous formats for entering data. You just have to choose the format corresponding to the data reported in primary studies. When you are uncertain, ProMeta helps you! In fact, within each data entry type the order of presentation of the data formats reflects precision of effect size computations, guiding your choice.
Several types of effect sizes
When you enter your data, ProMeta computes an effect size and automatically converts it in other effect size formats. You can choose among the following effect sizes:
- Cohen’s d
- Hedges’s d
- Unstandardized means difference
- Pearson’s correlation
- Fisher’s Z
- Odds ratio
- Ln odds ratio
- Peto odds ratio
- Ln Peto odds ratio
- Risk ratio
- Ln risk ratio
- Risk difference
- Rate ratio
- Ln rate ratio
- Rate difference
- Hazard ratio
- Ln hazard ratio
Flexible moderators
In ProMeta you can define three types of moderators: categorical, numerical decimal, and numerical integer moderators. Moderators are flexible, that means they can be treated as study-level, subgroup-level, comparison-level, wave-level, or outcome-level moderators. Furthermore, ProMeta offers efficient tools for recoding both categorical and numerical moderators.
Few clicks for running analyses
After data entry, you can easily define your plan of analyses:
- choose the computational model for analysis: fixed-effect model or random-effects model or both models
- choose the effect size type
- choose computational options for publication bias and moderator analyses
- select studies to be include in the analyses
- manage multiple subgroups, comparisons, waves, and/or outcomes
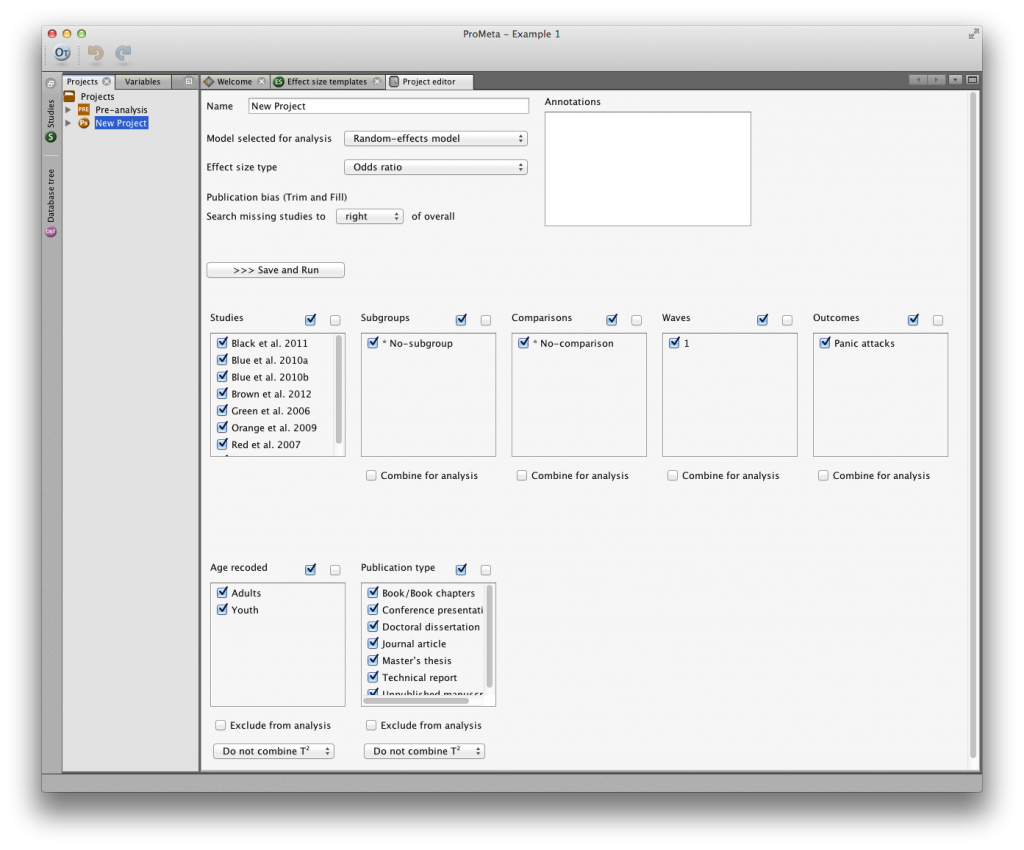
You just have to click “Save and Run” and in few seconds ProMeta will run all the analyses:
- results for each study
- overall effect size
- heterogeneity analysis
- sensitivity analysis
- cumulative meta-analysis
- moderator analysis (categorical and numerical moderators)
- publication bias analysis (funnel plot, trim and fill, Egger’s linear regression test, Begg and Mazumdar’s rank correlation test, fail safe N)
When you manage complex data structures, ProMeta reports in the Pre-analysis results of tests of differences between subgroups, comparisons, waves, and/or outcomes. These preliminary analyses provides information that can be useful for deciding whether or not combining subgroups, comparisons, waves, and outcomes.
If you want to analyze subgroups, comparisons, waves, and/or outcomes separately it is extremely easy. You can define and save as many projects as you want, analyzing in each of them your variables of interest.
High-quality graphs
ProMeta offers three high-quality graphs that you can easily export in PNG and include in your publication. In ProMeta, every graph uses the “Smart Resizing” system through which you can easily model graphs according to your preferences.
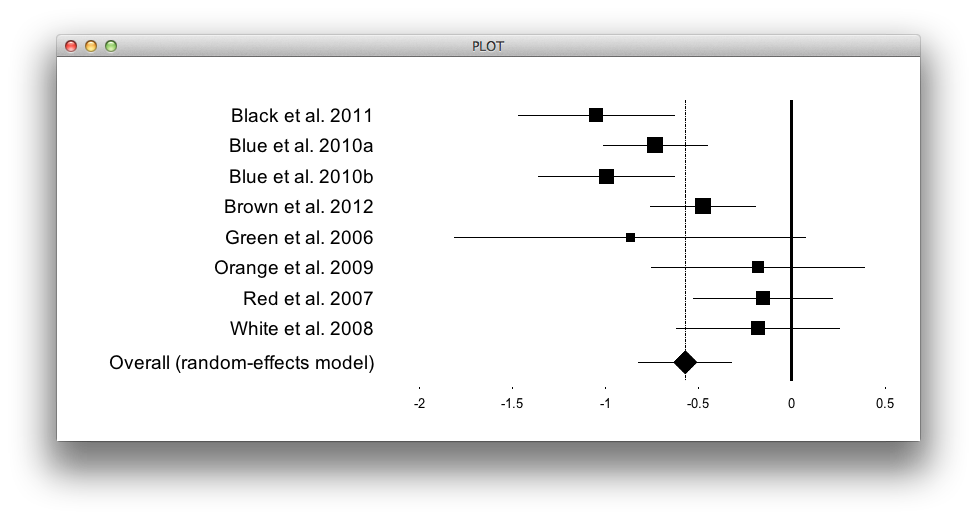
Forest plots with C.I.P. 
Forest plots are used to visualize results of various analyses (i.e., summary statistics for each study and overall results, sensitivity analyses, cumulative analyses, categorical moderator analyses). Thanks to the new software C.I.P. to obtain personalized high quality graphs has never been so easy!
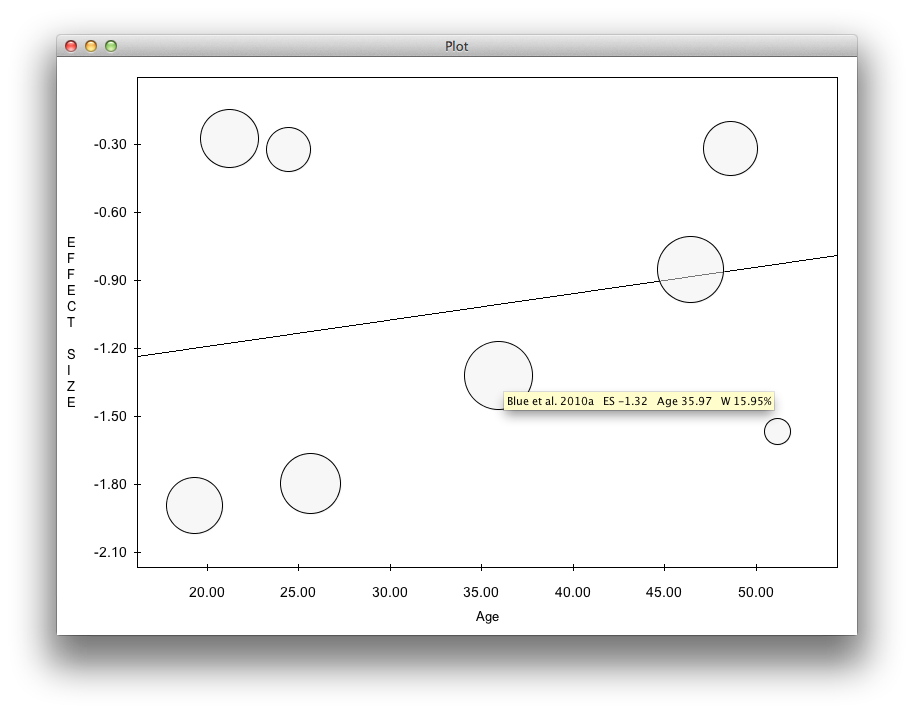
Scatterplots
Scatterplots are used to visualize results of numerical moderator analyses (i.e., meta-regressions)
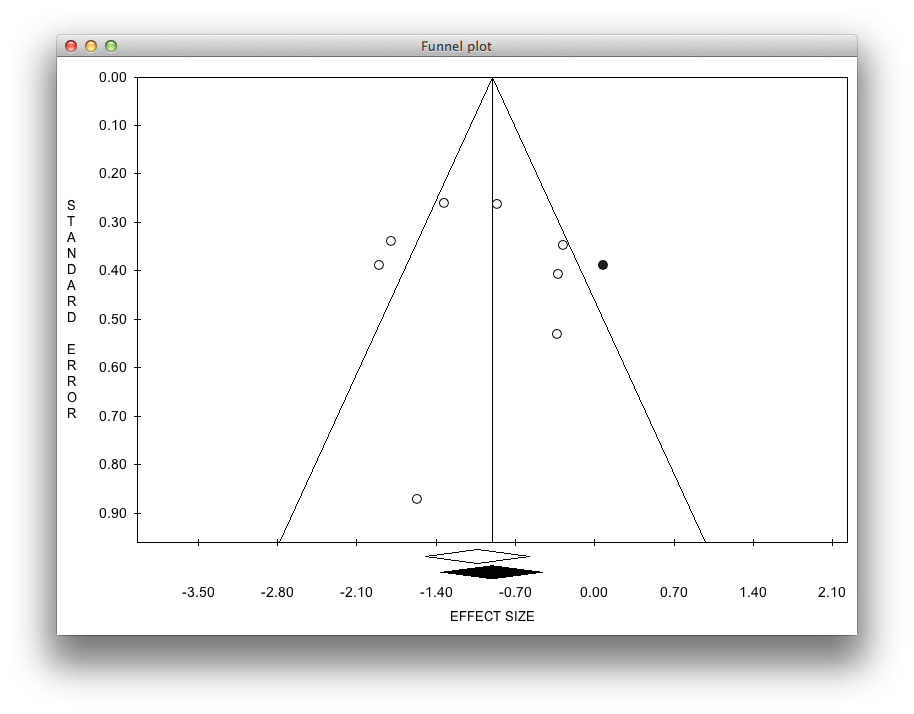
Funnel plots
Funnel plots are used to visualize results of publication bias analyses
Self-training
ProMeta is an extremely intuitive software. You can just take a look at the materials below to familiarize with ProMeta’s features.
- ProMeta Manual: reading the manual you will learn how to use ProMeta navigating through some practical meta-analytic examples. You will follow a step-by-step approach: you will start with a simple example to understand the basic features of ProMeta; then you will move to other two examples to learn how to deal with complex meta-analytic projects
11081 Downloads
Requirements
ProMeta is a software developed in Java. Generally, ProMeta can run on every system that supports Java. and can run on multiple operating systems:
The prerequisite for installing ProMeta is to have an updated version of Java. Java is developed by Oracle and is free of charge (www.java.com).
The software has not been updated since 2015. In recent years there have been radical changes in Java policies that make installation on some operating systems particularly difficult.
Available installers:
- Microsoft Windows
- Mac OS-X
- Linux
Java versions supported
- Java 8, is the ProMeta build Java version (2015)