What is a systematic review?
A systematic review (or research synthesis) is a review of an area of study based on a clearly formulated research question that uses systematic and explicit methods to identify, select, and evaluate relevant research. A systematic review (research synthesis) can use statistical techniques to provide a quantitative summary of study results.
What is the true meaning of meta-analysis?
The meta-analysis refers to a systematic review/research synthesis that provides a statistical synthesis of an area of study. Researchers can use the term meta-analysis in two ways:
a) to refer specifically to the statistical section included in a systematic review/research synthesis (e.g., Gender differences in anxiety: A systematic review and meta-analysis)
b) as a synonymous of a systematic review/research synthesis including a statistical section (e.g., Gender differences in anxiety: A meta-analysis).
Throughout this website we use the term meta-analysis in this second way.
The meta-analysis, introduced in the 70s by Gene Glass to test the effectiveness of psychotherapy, it is now widely applied in various fields (e.g., psychological, educational, medical, etc.). Meta-analysis is used to address several research questions, such as:
- Is a particular treatment effective? (e.g., is an experimental drug effective?)
- Are there differences between two groups? (e.g., do adopted children and biological children exhibit different levels of self-esteem?)
- Are two variables related? (e.g., is job satisfaction associated with family satisfaction?)
To answer these questions, meta-analysis provides a quantitative synthesis of study results available in a specific area of research.
Meta-analysis steps
Defining the research area
The first step in conducting a meta-analysis implies defining very clearly which is the focus of the meta-analysis. Which is the research question addressed by the meta-analytic review? For instance, we may want to study the efficacy of intervention aimed at reducing hypertension, or gender differences in depression, or associations between physical exercise and body weight. More generally, in the meta-analysis we can compare differences between two groups or examine associations between two variables
Defining inclusion and exclusion criteria
Inclusion and exclusion criteria define which studies are eligible or not for being included in the meta-analysis. They refer to:
- characteristics of the study (e.g., population, design)
- characteristics of the publication (e.g., language, type, year of publication)
Searching and selecting primary studies
In order to retrieve all the relevant literature it is necessary to use multiple search strategies. Main search strategies include:
- Search in reference databases (e.g., PsycINFO, ERIC, MEDLINE, EMBASE, Scopus, Web of Science, Dissertation abstract, etc.)
- Search in the reference list of reviews available on the same topic
- Search in the reference list of pertinent primary studies
- Search in indexes of journals that publish most papers on the topic of the meta-analysis (especially useful to find articles in press)
- Contacts with experts in the field
After having conducted the search, it is necessary to check each retrieved reference to see if it matches inclusion criteria. In this way, it is possible to identify the primary studies that would be included in the meta-analysis.
Coding primary studies
The coding is the process by which primary studies are examined in order to extract relevant data to perform the meta-analysis. The coding protocol serves as a guide to the coding procedure.
Computing effect sizes
For each study, it is necessary to compute an effect size, its variance, standard error, and confidence interval. The effect size is a measure of the magnitude of a relationship between two variables or a difference between groups. Main types of effect sizes are based on:
- means (Cohen’s d, Hedges’ g, raw unstandardized difference)
- binary data (risk ratio, odds ratio, risk difference)
- correlations (Pearson’s correlations, Fisher’s Z)
- survival data (hazard ratio)
The variance, standard error, and confidence interval provide an estimate of the precision of an effect size.
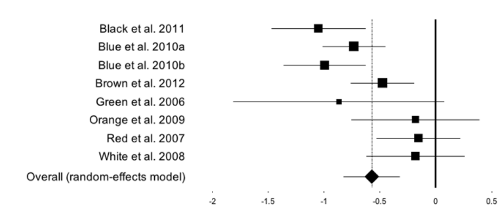
The best way of reporting these results is through a forest plot. The forest plot is a plot of effect sizes (with confidence intervals) of all the studies included in the meta-analysis.
Aggregating effect sizes
After having computed an effect size for each study it is possible to compute an overall effect size. In this step, it is possible to combine effect sizes by means of:
- Fixed-effect model: the assumption of this model it is that there is a true effect size common to all studies. In assigning a weight to each study, it takes into account only one source of variance: the within-study variance
- Random-effects model: the assumption of this model it is that the true effect size is normally distributed. In assigning a weight to each study, it takes into account two sources of variance: within-study variance and between-studies variance
Assessing heterogeneity
Heterogeneity across study effect sizes can be assessed through two statistics:
- Q statistic: is used for establishing if there is a significant heterogeneity across studies
- I2: is used to quantify the heterogeneity; it estimates the proportion of observed variance that reflects real differences in effect sizes
Testing moderators
Moderators (or predictors) are the factors which are assumed to affect the magnitude of the effect sizes across the studies in which these factors are present. If the moderator is categorical, its effect is tested by a subgroup analysis; if the moderator is continuous, its effect is tested by a meta-regression.
Evaluating publication bias
Publication bias exists when published studies (those that can be easily retrieved) differ systematically from unpublished studies (gray literature). In the meta-analysis, the potential impact of publication bias can be assessed through different methods:
- funnel plot
- Egger’s linear regression method
- Begg and Mazumdar’s rank correlation method
- Duval and Tweedie’s Trim and Fill method
- Rosenthal’s Fail-safe N
Publishing a meta-analysis
In order to publish a high-quality meta-analysis is useful to refer to meta-analysis reporting standards. In particular, there are various guidelines currently available in various research fields:
- MARS (Meta-analysis reporting standards) included in the Publication Manual of the American Psychological Association, 6th ed. (2010)
- PRISMA (Preferred Reporting Items for Systematic Reviews and Meta-Analyses): it consists of a Statement, Explanation, Checklist, and Flow diagram
- MOOSE (Meta-analyis of Observational Studies in Epidemiology; Stroup et al., JAMA 2000)